
Estimates of Oil and Gas Volumes; Unraveling and Understanding the Terminology from Oil in Plan to Proved Reserves
A white paper written by Ryder Scott staff for an audience not familiar with the terms commonly used in oil and gas reserves evaluation.
November 2022
Introduction
Oil and gas industry professionals, such as petroleum engineers and geoscientists, commonly use certain words and terminology specific to the industry. It is important to understand the meaning of and difference between these terms, as press releases or disclosures from exploration and production companies (E&P companies) are distributed in the public domain and therefore, read by an audience outside of the oil and gas industry. Certain industry-specific terminology may be (inadvertently) inappropriately interchanged or simply misused, causing unintended harm related to the use of the disclosed information. The purpose of this paper is to provide the reader a better understanding of certain frequently used terms.
It is important to note the complexity involved in oil and gas exploration and the effort it entails to bring that oil and gas to a market. To begin with, one must understand and appreciate that oil and gas is located far below the Earth’s surface – ranging from hundreds of feet to tens of thousands of feet. It is contained within rock below the surface and found using various tools and techniques specific to the industry, such as seismic, gravity and magnetics, and well log retrieval and interpretation. Geoscientists would describe this rock primarily as sandstone or limestone. However, recent technological advancements, such as hydraulic fracturing (“fracing”) and horizontal drilling, have unleashed a significant amount of additional oil from much denser rock (shale) – as dense as the concrete that makes up our interstate highways. All of the oil and gas we use to generate energy or gasoline once flowed through these rocks, located far below the Earth’s surface, to a wellbore and brought to the surface.
This paper will address volume-quantification terms, such as reserves, resources, and hydrocarbons in-place. These terms are significantly different in what they refer to, and the goal of the following discussion is to provide a high-level understanding of each term to minimize misunderstanding or misrepresentation in future reports and/or publications.
How much oil and gas exists beneath the surface?
There is a fixed amount of oil and gas remaining to be discovered, and recovered, beneath the earth’s surface; hence, oil (for the duration of the paper, the term oil will be used to refer to crude oil, natural gas, or the combination of both) is considered a non-renewable resource. While the amount of oil on our planet is fixed and, therefore, limited, the amount of oil that we can recover (or produce) in the future varies. The three biggest reasons why this recoverable amount changes with time are 1) new information acquired may provide more refined (better) estimates, 2) the development of new exploitation technologies and 3) the economics related to the production of the oil. The higher the oil price, the greater the amount that can be recovered – it is a simple supply and demand relationship. Uneconomic or marginally economic projects will not be developed at a lower oil price since no one would invest in those projects. When the oil price increases, these projects move into the desirable investment arena, yielding more oil available for production.
Estimating the amount of oil in place
Have you ever participated in a challenge to guess the number of jellybeans in a jar? In such a game, you would estimate the number of jellybeans based on various factors, such as the size (volume) of the container, the size of the individual jellybeans, and your general experience and knowledge. The time you spend to conduct your estimate, the depth of analysis, and the level of accuracy will likely vary widely depending on the information at hand and, to some degree, the attractiveness of the winning prize. Anything is fair game, ranging from a guesstimate based on a gut feeling, to buying a similar container and counting how many same size jellybeans are needed to fill it to the same level. Even with the latter more thorough approach, you will not get to the exact answer, but you will arrive closer to the actual number. Estimating the oil in the ground is somewhat of a similar process; except, unlike the jellybeans in the jar (which can be counted), it is not possible to measure the exact amount of barrels of oil in the subsurface reservoir. Therefore, the volume of oil in the reservoir is an estimate that is within a certain range of values. We never know exactly how much oil is initially in the subsurface reservoir prior to production; or even after production – once wells are drilled and placed on production and the amount that is recoverable is depleted. At this point there generally remains a substantial amount of oil left in the subsurface reservoir that is commercially and/or physically unrecoverable.
The number of people participating in the jellybean challenge will establish the number of guesses or range of estimates for jellybeans in the jar. What do we do with this? Experience shows that when you have a large number of estimates, they tend to follow a normal distribution or a standard bell-shaped curve. The ultimate use of this estimated total number of jellybeans in the jar will determine how you proceed and what number (along the bell-shaped distribution) is important. For example, if a guess more than the actual number leads to disqualification, you would want to pick a low-side number, a little lower than the average. If there is no penalty for going over, then you might pick an average of all the estimates. Perhaps there may be a penalty for being too low, then you might pick a high side number, a little higher than the average. Your pick would be according to your strategy for winning and the rules of the game.
Since the stakes are higher, oil and gas volume estimation employs a more sophisticated approach, utilizing all available data, instead of simply guessing. Applying this approach to the jellybean challenge, all available factors or parameters that play a role in defining the number of jellybeans (J) in the jar would be used, such as:
- Volume (V) of the jar, represented in cubic inches (in3),
- Percentage or fraction (F) of the volume in the jar that is occupied by the jellybeans, and
- Average size (S) of the jellybeans represented as in3 per jellybean.
A simple equation would yield an estimate of the number of jellybeans as follows:

As an example, assume the following parameters:
- V = 50 in3: The jar is full to the top with jellybeans;
- F = 0.7: The percentage is occupied by jellybeans – the other 30% is occupied by airspace
- S = 0.25 in3: The average jellybean is one fourth of a cubic inch in size.
The number of jellybeans would amount to:

Similarly, engineers and geoscientists can estimate the number of barrels of oil in the reservoir. The most commonly used equation is the volumetric equation. The parameters that play a role in such an estimation typically have a degree of uncertainty, usually because a limited amount of naturally varying data is available to perform that calculation.
In order to represent the uncertain or imprecise parameters, engineers and geoscientists will assign a range of values to each parameter. The more conservative value represents the low case. The value that is considered to have the highest expectation to occur is the middle (mid) or most likely case, and the value that represents the optimistic side is considered the high case. Generally, all uncertain parameters of the volumetric equation are represented by a range of low, most likely, and high values, which is called a distribution of values. Oftentimes, a probabilistic analysis is then performed, whereby a value is randomly selected for each parameter from its assigned distribution of values and inserted into the volumetric equation to calculate what is called the original oil in place (OOIP) in the reservoir, similar to the original number of jellybeans in the jar. The same calculation is performed numerous times (usually around 10,000 times) with a specialized software; each calculation (called a realization) selects a different set of random values within the established range for each parameter. The result is a distribution of values that defines the calculated OOIP for the reservoir.
In a probabilistic analysis such as this, the low side estimate is referred to as the P90 value, the most likely estimate is referred to as the P50 value, and the high side estimate is the P10 value. For a P90 value, which is the conservative value, there should be at least a 90% probability that the actual quantity of OOIP will equal or exceed this value. For a P50 value, there should be at least a 50% probability that the actual quantity of OOIP will equal or exceed this most likely or best estimate. Stated differently, there should be an equal chance that the actual quantity of OOIP is equal to or less than this value. Finally, for a P10 value, which is the optimistic value, there should be at least (only) a 10% probability that the actual quantity of OOIP will equal or exceed this value.
As a side note, some evaluators will use a deterministic approach to estimate the low, middle, and high values of OOIP. The deterministic approach uses discrete values of parameters for each estimate, without the use of the probabilistic method. Discrete conservative values are used for the low case, most likely values are used for the middle or best case, and optimistic values are used for the high case. We will continue to use the probabilistic method to illustrate the process since it helps to simplify the discussion.
The estimation of OOIP is important to evaluation engineers, geoscientists and E&P companies as it defines the potential size of a reservoir that has been or is yet to be discovered. Furthermore, it is the starting point for estimating the recoverable portion of oil from a reservoir. The next sections discuss the industry terms resources and reserves. These terms describe the volume of oil – or the portion of OOIP – in a reservoir that is anticipated to be recoverable.
Estimating how much of the OOIP can be produced
As stated above, assessing the subsurface resources volume requires an estimate of OOIP. Of the OOIP, the amount that might eventually be produced, that is, the recoverable portion, is considered next. The factors that influence the recoverable amount include the characteristics of the actual oil (e.g., viscous or heavy with poor flow qualities or light with better flow capability), the characteristics of the rock (e.g., porous with interconnected pore space, permitting the oil to flow), the geological characteristics of the reservoir and the available reservoir energy to transport the oil to the wellbore and lift it to the surface, and the type of operations managed by the operator (e.g. installation of pumping units or other type of artificial lift to assist in lifting the oil). These all affect the percentage of the OOIP that can be extracted from the subsurface. Therefore, even if a reservoir contains a large amount of oil, only a fraction of it, generally in the range of 10% to 40% for oil reservoirs (higher ranges for gas), will be produced. The fraction of the OOIP that is recovered (or to be recovered) is called the recovery factor (RF). Regardless of the estimate of OOIP, the amount of oil estimated to be recovered from the reservoir is the volume that is most important from a commercial perspective. For example, an investor must understand that even though a huge oil accumulation might exist, meaning a large amount of OOIP, it is the portion of the oil that is economically recoverable that is pertinent to the economic value.
There can be considerable uncertainty in estimating the amount of oil in the subsurface that can be economically produced as well as the likelihood that those volumes will actually be commercially recovered. In order to explain this aspect of oil and gas exploration and exploitation, the next section focuses on certain applicable terms that shed light on how estimates of recoverable oil are technically classified and categorized.
Estimating how much of the OOIP can be produced
The Society of Petroleum Engineers Petroleum Resources Management System (SPE-PRMS) is one of the most common oil and gas classification systems used throughout the world. The SPE-PRMS defines petroleum resources as “all quantities of petroleum naturally occurring within the Earth’s crust, both discovered and undiscovered (whether recoverable or unrecoverable), plus those quantities already produced” (SPE-PRMS 2018 Section 1.1.0.2).
As quoted above, resources are separated into discovered and undiscovered in the SPE-PRMS system. The recoverable resources are divided into production (quantities already produced), reserves, contingent resources and prospective resources as well. It is the recoverable portion of petroleum resources that can potentially result in commercial income-producing projects for an E&P company. The unrecoverable portion is generally recognized as volume that will remain in the ground (within subsurface reservoirs) until new technology or commercial conditions change such that some additional portion can be considered recoverable.
The distinction between prospective and contingent resources depends on whether or not there exists one or more wells and/or other data indicating that a discovery has been made by the drilling of an exploratory well.
The distinction between contingent resources and reserves depends on whether a project to develop the discovered petroleum resources is commercial or not.
In this sense, commercial defines if a company considers a project worthy of continued investment in order to eventually bring recoverable volumes to market.
Provided here is an illustration of the Resources Classification Framework as provided in the 2018 SPE-PRMS Guidelines.
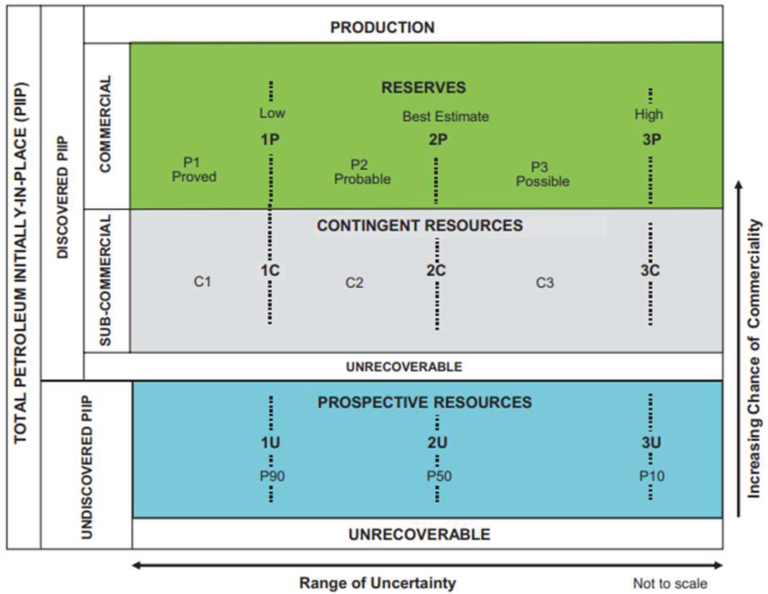
Source: SPE-PRMS – Figure 1.1 Resources Classification Framework
Below is a description of the three classes of resources, beginning with the most uncertain and highest risk, to the most likely to be recovered, and finally the least amount of risk and uncertainty. In defining these terms, it is important to understand that category describes the uncertainty related to an estimated volume of recoverable resources.
Prospective Resources: Estimations of prospective resources volumes are the most uncertain and carry the highest risk – two different terms in defining resources. Prospective resources have not been discovered and there is a risk that upon drilling an exploratory well in search of those unknown volumes, the result would be a dry hole, or no petroleum resources in the subsurface reservoir. This risk is known as the geologic chance of discovery, a factor which typically is less than 30%. Furthermore, if indeed a discovery is made, there is a risk that the discovered accumulation will not be commercially developed; a risk known as the chance of development. The multiplication of these two risk factors (chance of discovery multiplied by chance of development) is known as the chance of commerciality and describes the overall risk that is associated with an estimated volume of prospective resources.
Estimates of prospective resources are further categorized according to the uncertainty related to the amount of oil that can potentially be produced, assuming a discovery has been made. As described above, in order to represent this uncertainty, estimators generally express the potentially recoverable volumes of prospective resources in terms of a low estimate, a most likely or best estimate, and a high estimate, in order of increasing uncertainty. These three estimates (low, middle and high) are known as categories of resources. Using the probabilistic method, assuming a successful discovery there should be at least a 90% probability (P90) that the actual quantities recovered will equal or exceed the low estimate (1U), there should be at least a 50% probability (P50) that the actual quantities recovered will equal or exceed the best estimate (2U) and there should be at least a 10% probability (P10) that the actual quantities recovered will equal or exceed the high estimate (3U). There can be a vast difference in volume between a low estimate and a high estimate (note that the abbreviations 1U, 2U, and 3U are specified in the PRMS document).
Identifying the risk and uncertainty related to reported volumes of prospective resources is critical to understanding the potential viability and worth of such reported quantities. This is where the experience and judgment of the engineering and geological evaluators are important.
Contingent Resources: SPE-PRMS defines contingent resources as “those quantities of petroleum estimated, as of a given date, to be potentially recoverable from known accumulations, by the application of development project(s) not currently considered to be commercial owing to one or more contingencies” (SPE-PRMS 2018, Section 1.1.0.6B).
Two of the most prominent contingencies are related to economic conditions – product prices and costs to produce, and technology. Both of these contingencies result in risk and uncertainty related to recovery of such volumes. In terms of economics, a low oil price may render the volumes uneconomic, thus an oil producer would not invest capital to recover those volumes. An example of a technological contingency is if equipment or methodologies to lift the oil from the subsurface are unavailable at the current time to produce the volumes economically. As stated by the SPE-PRMS, “for Contingent Resources, evaluators should focus on gathering data and performing analyses to clarify and then mitigate those key conditions or contingencies that prevent commercial development” (SPE-PRMS 2018, Section 1.1.0.6B).
While prospective resources incur a chance of geologic discovery and a chance of development, contingent resources are only burdened by the chance of development, since a discovery has already occurred. The chance of development describes the probability (risk) that a known reservoir (already discovered) will be commercially developed. In other words, it describes the chance that all contingencies will be resolved, and the project will be analyzed as being commercial. In addition, the oil company has demonstrated its firm intention to proceed with the development of the project.
Estimates of contingent resources are also categorized according to the uncertainty related to the amount of oil that can potentially be produced. Similar to prospective resources, in order to represent this uncertainty, estimators generally express the potentially recoverable volumes of contingent resources in terms of a low estimate, a most likely estimate, and a high estimate, in order of increasing uncertainty. Using the probabilistic method, there should be at least a 90% probability (P90) that the actual quantities recovered will equal or exceed the low estimate (1C), there should be at least a 50% probability (P50) that the actual quantities recovered will equal or exceed the best estimate (2C), and there should be at least a 10% probability (P10) that the actual quantities recovered will equal or exceed the high estimate (3C). Once again, there can be a vast difference in volume between a low (1C) estimate and a high (3C) estimate.
Reserves: The third and highest classification of resources in terms of commercial maturity is reserves. SPE-PRMS defines reserves as "those quantities of petroleum anticipated to be commercially recoverable by application of development projects to known accumulations from a given date forward under defined conditions. Reserves must satisfy four criteria: they must be discovered, recoverable, commercial, and remaining (as of a given date) based on the development project(s) applied” (SPE-PRMS 2018, Section 1.1.0.6A).
Because volumes of estimated reserves have been discovered and developed or committed for development, they are not attributed a risk factor (chance of geologic discovery or chance of development). That said, it should be understood that reserves are still in the subsurface and yet to be produced. They are not volumes that are in storage tanks on the surface or in a pipeline at the point of transfer. Barrel for barrel, these future recoverable volumes have the greatest impact on the value or worth of a company as it relates to exploration and production operations. Oil and gas companies periodically publish a reserves report that reflects the volumes they expect to recover under specific economic conditions. The United States Securities and Exchange Commission (SEC) requires that public oil companies disclose their estimated reserves in an annual report that is filed with the Commission. To demonstrate impartiality in those estimates, oil companies often hire third party evaluators such as Ryder Scott in order to estimate those volumes. By rule, the third-party report (such as a Ryder Scott report) is inserted into a company’s annual (10K for a domestic company and 20F for a foreign company) filing if that third party is referenced in the filing.
Estimates of reserves are also categorized according to the uncertainty related to the amount of oil that can potentially be produced. Similar to prospective and contingent resources, in order to represent this uncertainty, estimators generally express the recoverable volumes of reserves in terms of a low estimate, a most likely estimate, and a high estimate, in order of increasing uncertainty. Using the probabilistic method, there should be at least a 90% probability (P90) that the actual quantities recovered will equal or exceed the low estimate (proved or 1P), there should be at least a 50% probability (P50) that the actual quantities recovered will equal or exceed the most likely estimate (proved plus probable or 2P) and there should be at least a 10% probability (P10) that the actual quantities recovered will equal or exceed the high estimate (proved plus probable plus possible or 3P). Once again, there can be a vast difference in volume between a proved (1P) estimate and a proved plus probable plus possible (3P) estimate.
Proved reserves provide the lowest uncertainty or highest probability of being recovered. While still an estimate and with no guarantee that the volumes will be eventually recovered, if properly estimated, the probability is high at 90%. Barrel for barrel, proved reserves possess the highest value.
Incrementally, the difference in volume between 2P and 1P reserves is designated as probable reserves. SPE-PRMS defines probable reserves as “those additional Reserves which analysis of geoscience and engineering data indicate are less likely to be recovered than Proved Reserves but more certain to be recovered than Possible Reserves. It is equally likely that actual remaining quantities recovered will be greater than or less than the sum of the estimated Proved plus Probable Reserves (2P) (SPE-PRMS 2018, Section 2.2.2.8B).
Many oil companies base their future development plans on the 2P reserves, considering them, as the name indicates, their most likely estimate. However, as the definition makes clear, there is greater uncertainty related to these volumes than the proved volumes. Barrel for barrel, probable reserves should be ascribed a lower economic value than proved reserves due to the greater uncertainty pertaining to their recovery.
Incrementally, the difference in volume between 3P and 2P reserves is designated as possible reserves. SPE-PRMS defines possible reserves as “those additional reserves that analysis of geoscience and engineering data suggest are less likely to be recoverable than Probable Reserves. The total quantities ultimately recovered from the project have a low probability to exceed the sum of Proved plus Probable plus Possible (3P), which is equivalent to the high estimate scenario. When probabilistic methods are used, there should be at least a 10% probability that the actual quantities recovered will equal or exceed the 3P estimate (SPE-PRMS 2018, Section 2.2.2.8C).
It follows that possible reserves possess a high degree of uncertainty; much higher than proved and probable reserves. As expected, possible reserves should be ascribed a lower economic value per barrel, than proved reserves and probable reserves due to the greater uncertainty pertaining to their recovery.
Public Disclosure
Different regulatory bodies throughout the world have specific rules for company disclosures pertaining to the reporting of reserves and/or resources. For example, in the U.S., the Securities and Exchange Commission (SEC) only allows the reporting of reserves (proved, probable, and possible), and most companies will only report proved reserves, even though they can report all three categories. Many companies prefer to inform the investing public what is highly likely to be recovered (i.e. proved reserves), thereby providing a high level of confidence in the estimates along with greater certainty in their ability to deliver the volumes.
Regulatory bodies outside of the U.S. may allow or even require the reporting of additional classifications and categories of resources in disclosures to the investing public. For example, National Instrument 51-101 (NI 51-101), which governs the disclosure of oil and gas activities for securities regulatory purposes in Canada, requires reporting proved and probable reserves and allows for contingent and prospective resources to be reported.
In Summary
This paper is intended to provide a high-level overview of the complete range of resources volumes, from the estimated amount of (the total) undiscovered and discovered oil in the ground (OOIP), to potentially recoverable volumes not yet discovered (prospective resources), potentially recoverable but non-commercial volumes of discovered resources (contingent resources), and finally to the estimates of commercially recoverable remaining reserves.
We have described the categories of resources, which pertain to the uncertainty in the range of recoverable volumes that are assigned to each one of the above classifications of resources. In this regard, for the prospective resources we have the 1U, 2U and 3U estimates; for the contingent resources we have the 1C, 2C and 3C estimates; and for reserves we have the proved (1P), proved plus probable (2P) and proved plus probable plus possible (3P) estimates. For each classification (prospective, contingent or reserves), each successive category carries a higher level of uncertainty.
While it may be useful to know how much oil is estimated to be in the ground, determining the amount that can be recovered is of greater significance and essential for investment purposes. Recoverable volumes of resources depend on many factors, including among others, the geological nature of the reservoirs, the composition of the hydrocarbon fluids, the operating methods and type of equipment utilized, and the commercial or economic environment (oil prices and costs to drill, produce and transport products). Many of these are complex factors requiring the knowledge and experience of many trained professionals in the geological and engineering professions.
World standards and guidelines, like the SPE-PRMS were established to assist the oil industry in defining their resources volumes. They also are intended to assist the public in understanding the risk and uncertainty related to the various stages of exploitation of hydrocarbon resources. It is not uncommon for public announcements to be inadvertently unclear or nonspecific in the types of volumes reported. A company or reporter might only report the high estimate and not disclose the related high uncertainty and risk associated with that volume, or the classification (reserves, contingent or prospective) may not be disclosed. It is important that basic fundamental elements of these guidelines, as presented herein, are understood by anyone taking an interest in investment opportunities in the oil and gas sector.
One Last Note
The foregoing discussion has been at a high-level and does not particularly delve into the complex technical nature of many of the terms and concepts presented. This was deliberate, since the exploration and production of oil and gas is quite complicated, both in terms of the estimation of the resources volumes as well as the actual exploration, drilling, completion and production of such hydrocarbon products. Teams of petroleum engineers and geoscientists work to maximize the recovery of oil and gas, while limiting the environmental impact of the operations, to maximize the return on investment from marketing these products. Please reach out to info@ryderscott should you desire a more in-depth discussion on the details related to the different guidelines and reporting systems (particularly revolving around oil and gas investing in North America and worldwide).